 GraphAbs
Biology & medicine
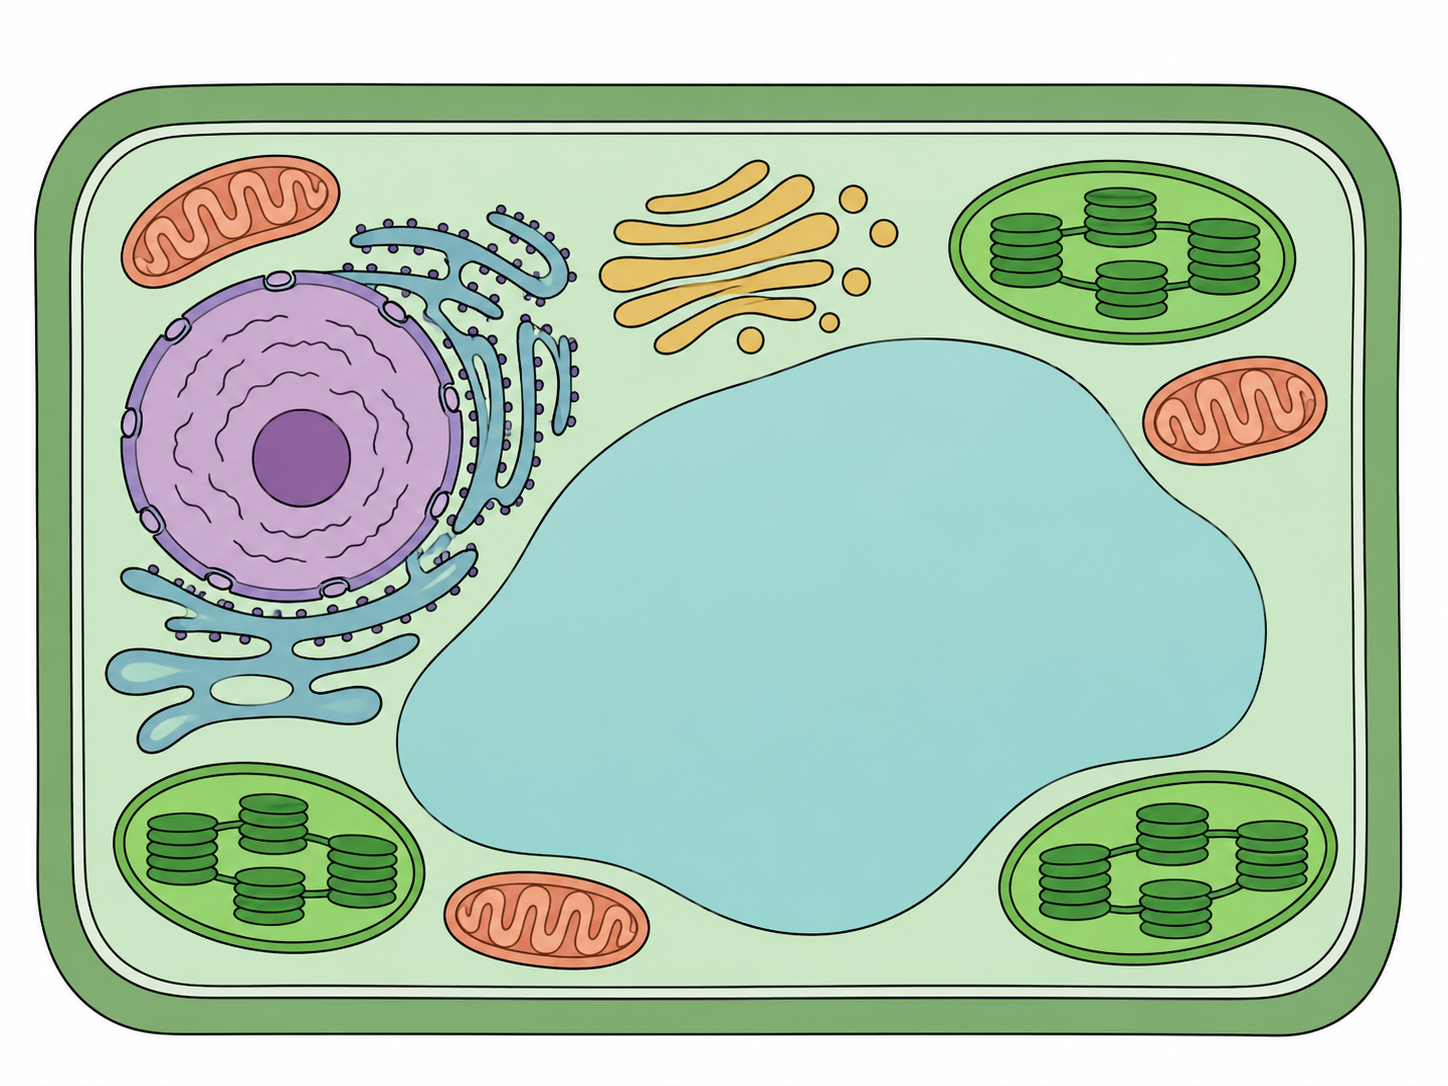
Plant cell structure, simplified
Start at the boundary, then locate the large storage compartment and the organelles involved in energy conversion.
SCIENTIFIC FIGURE LIBRARY
Browse scientific figure examples, diagram templates, and research data visualizations. Explore the structure, review the notes, then adapt a starting point for your own work.
Start at the boundary, then locate the large storage compartment and the organelles involved in energy conversion.
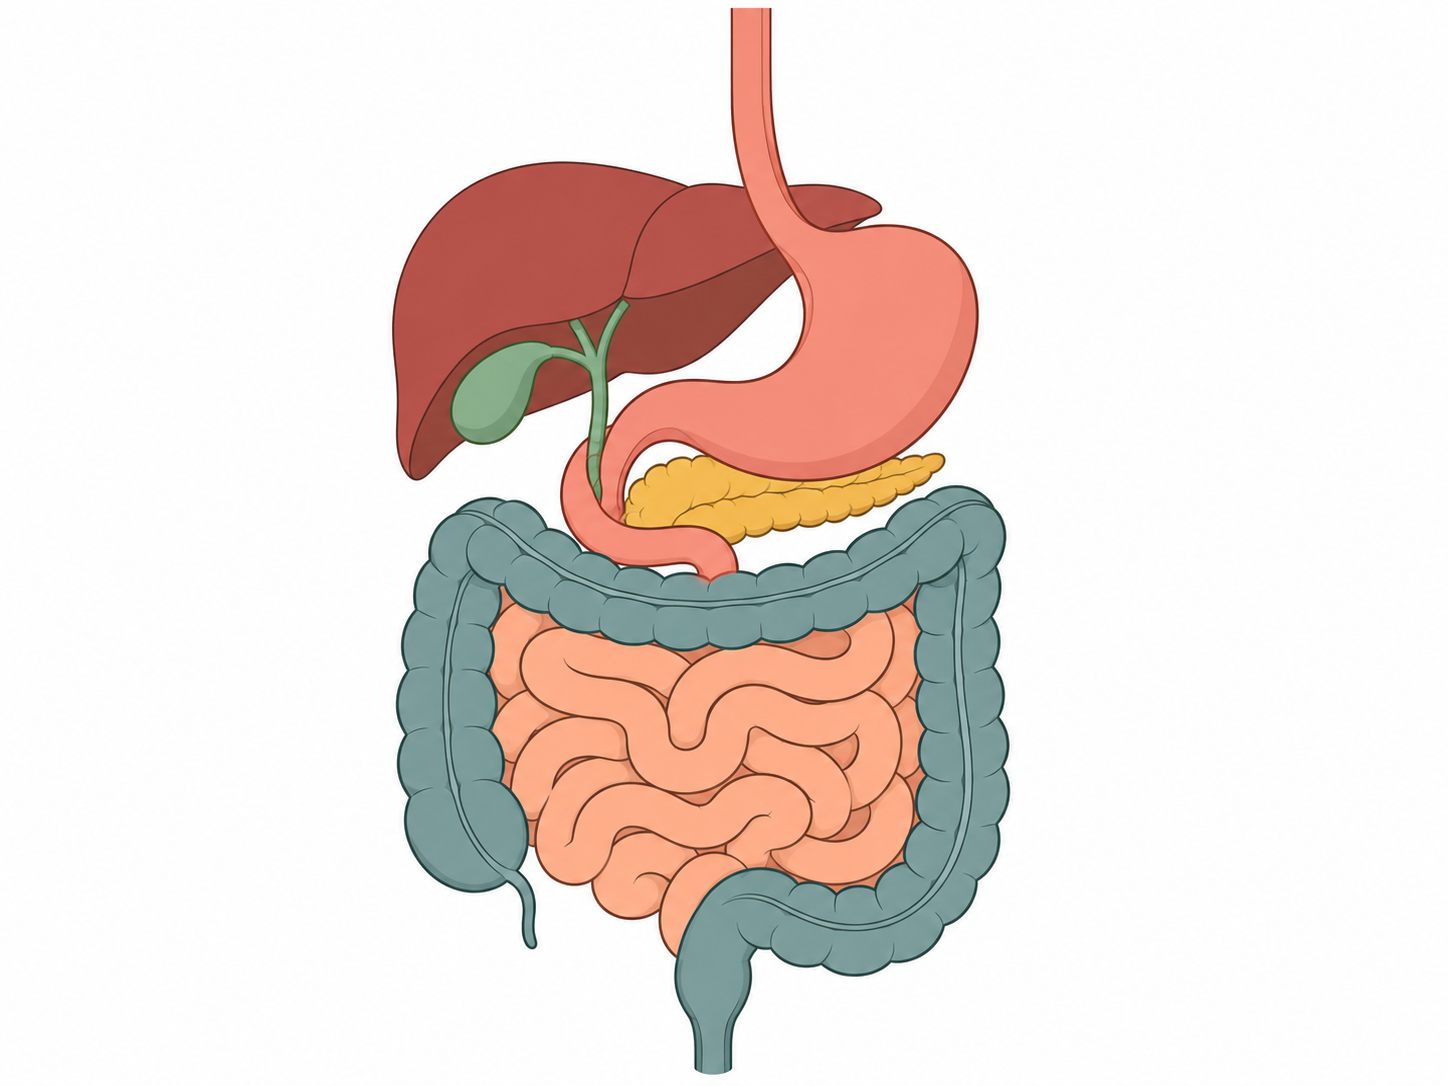
The main tract is continuous, while several accessory organs release substances that help break food down.
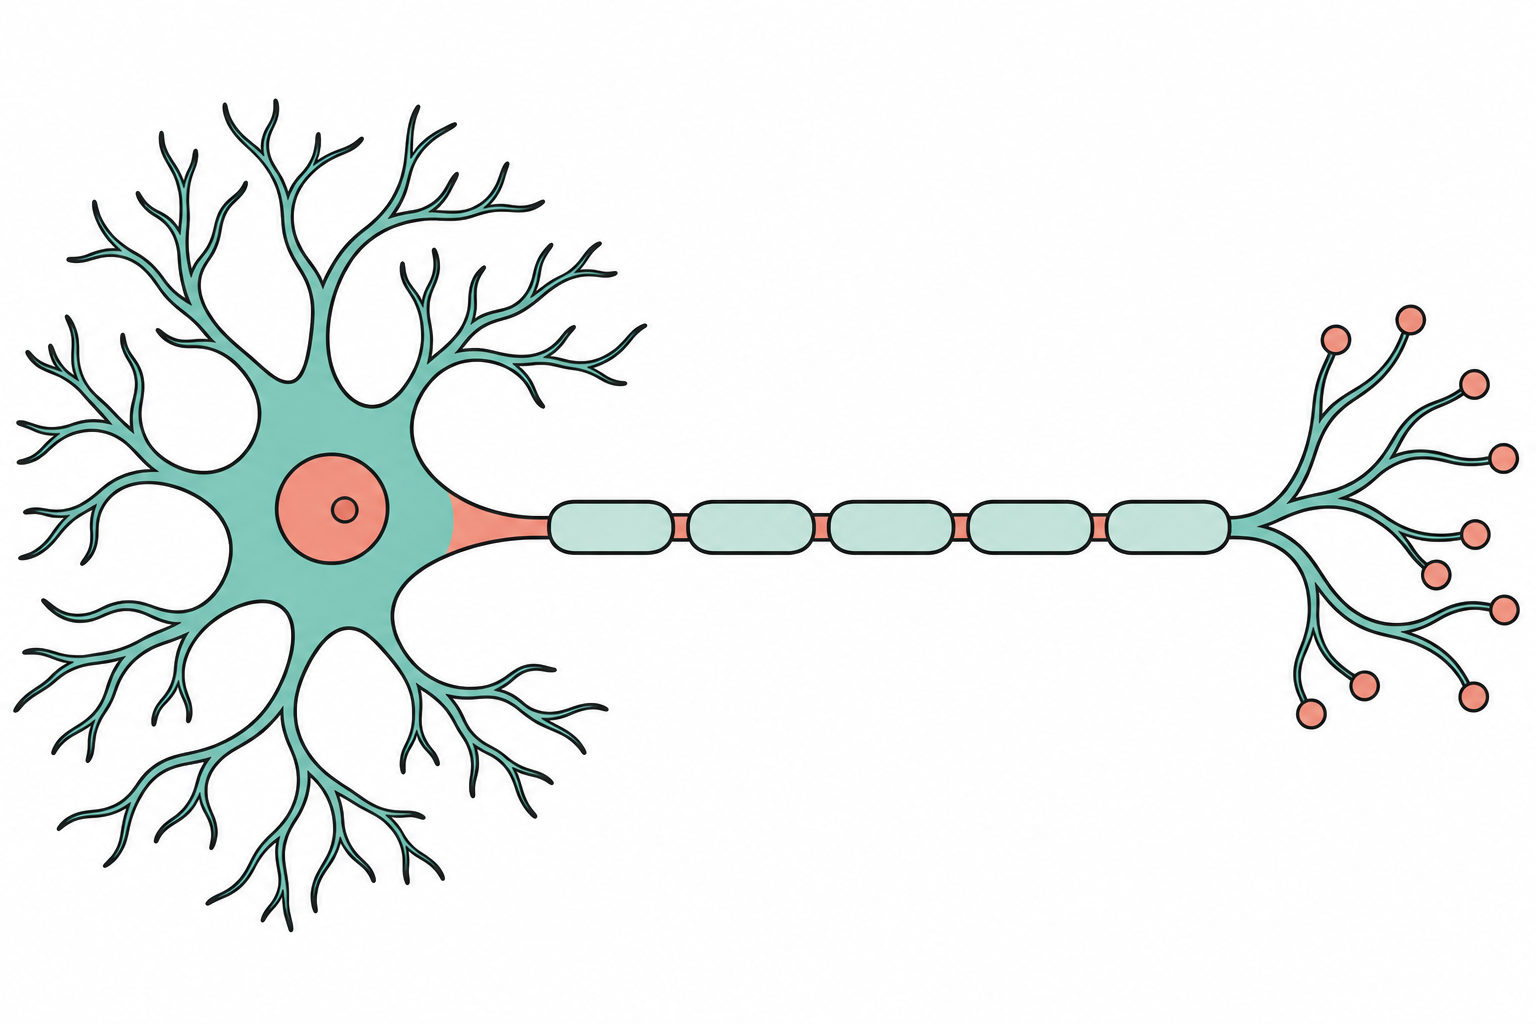
Use the cell body as the anchor, then trace the long projection and its terminal branches.
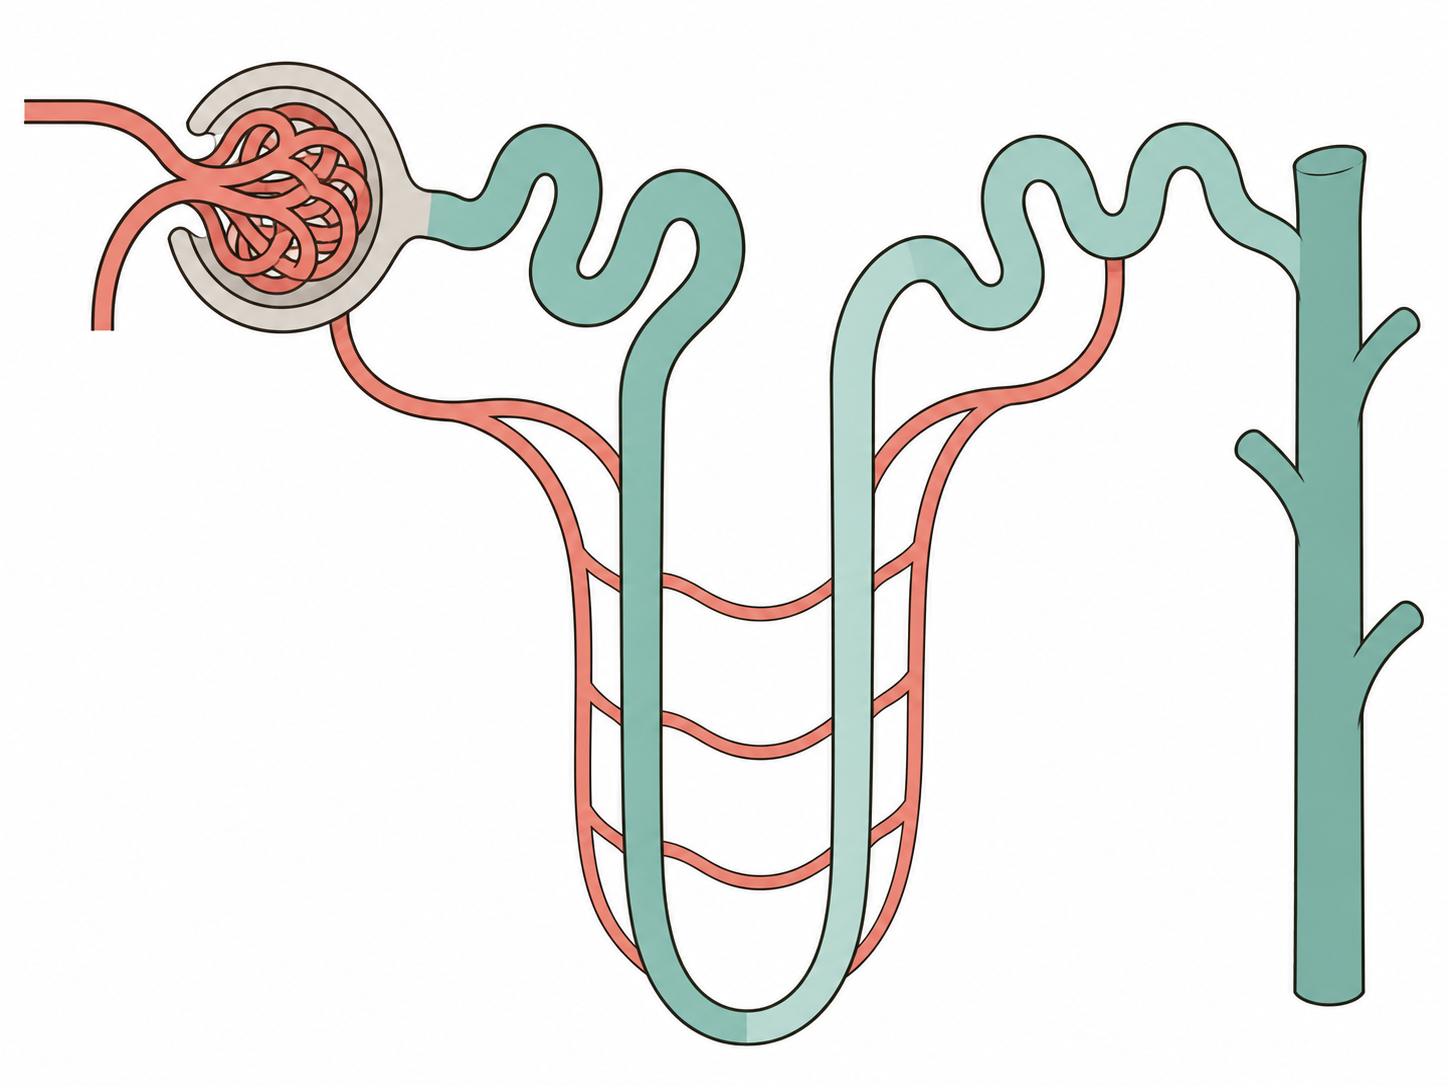
Begin at the renal corpuscle, then follow the tubule to the collecting duct.
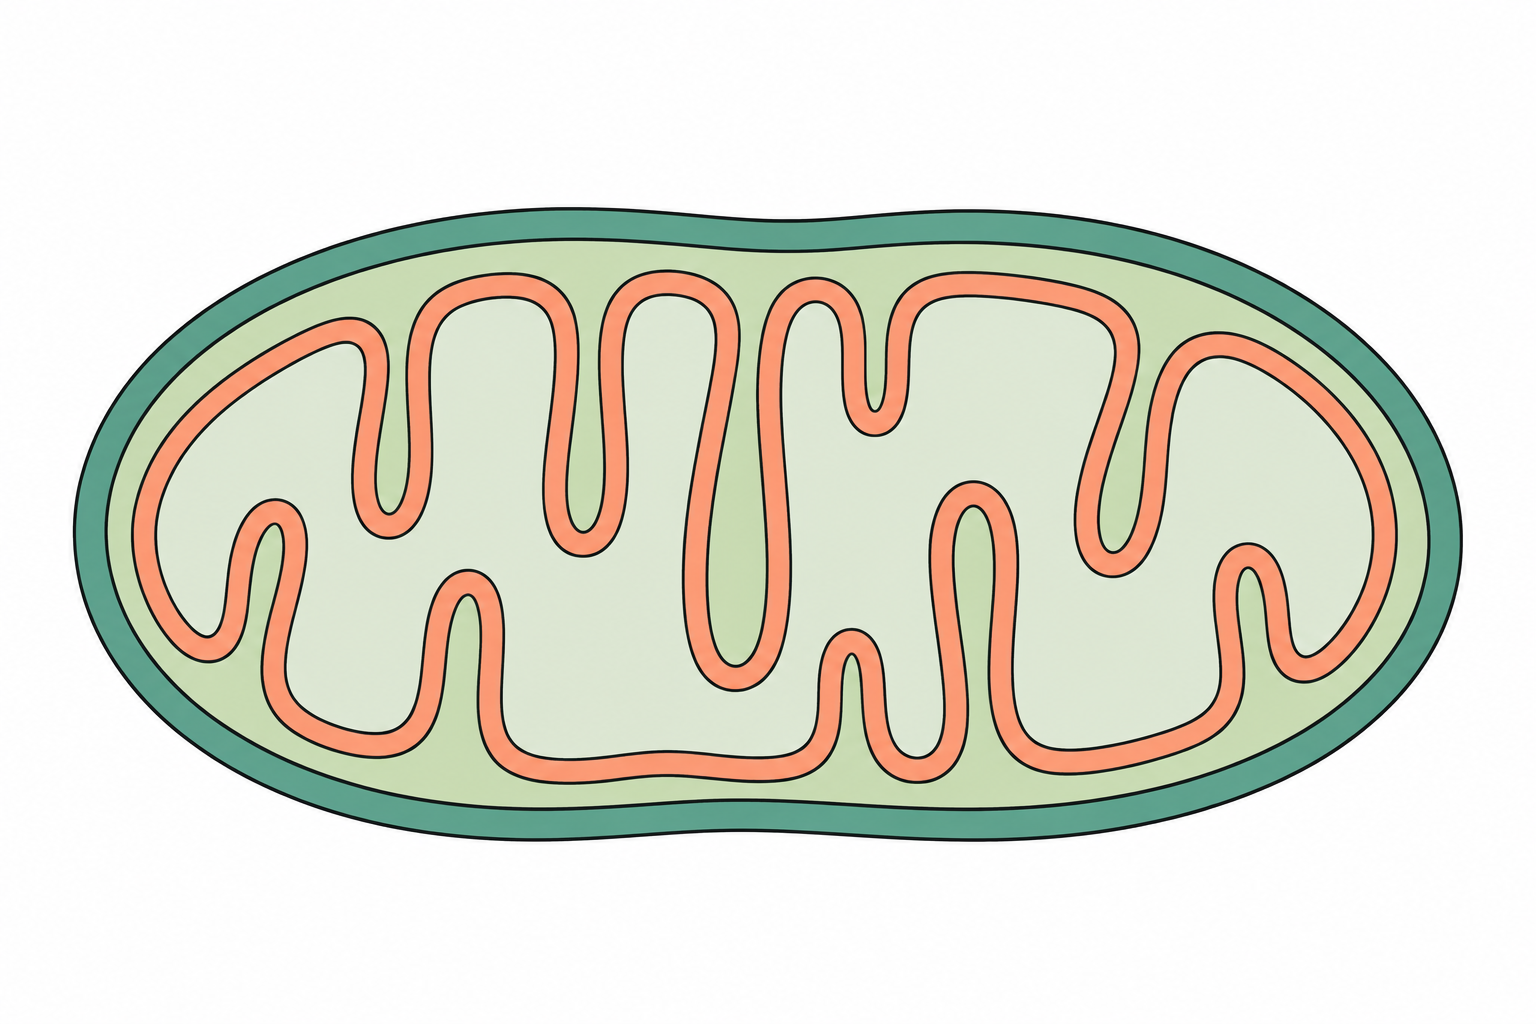
The two membranes separate compartments with different roles in energy metabolism.
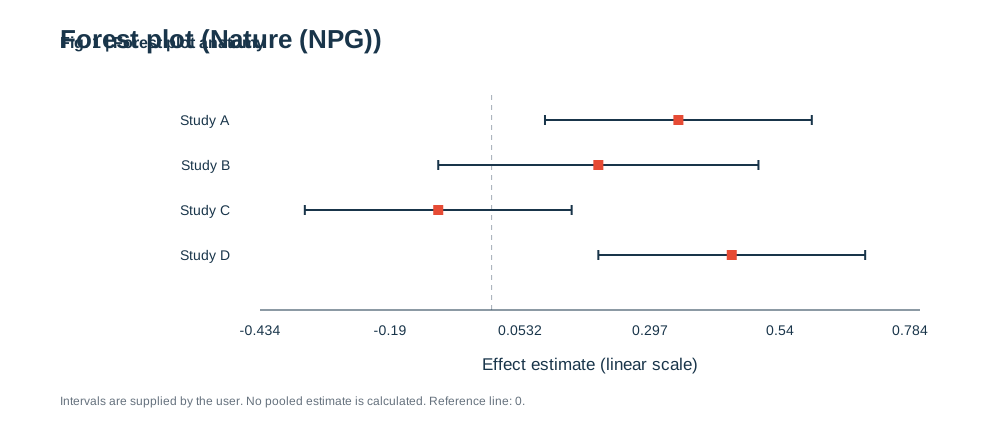
Read each row as an estimate plus an uncertainty interval, then compare it with the reference line.
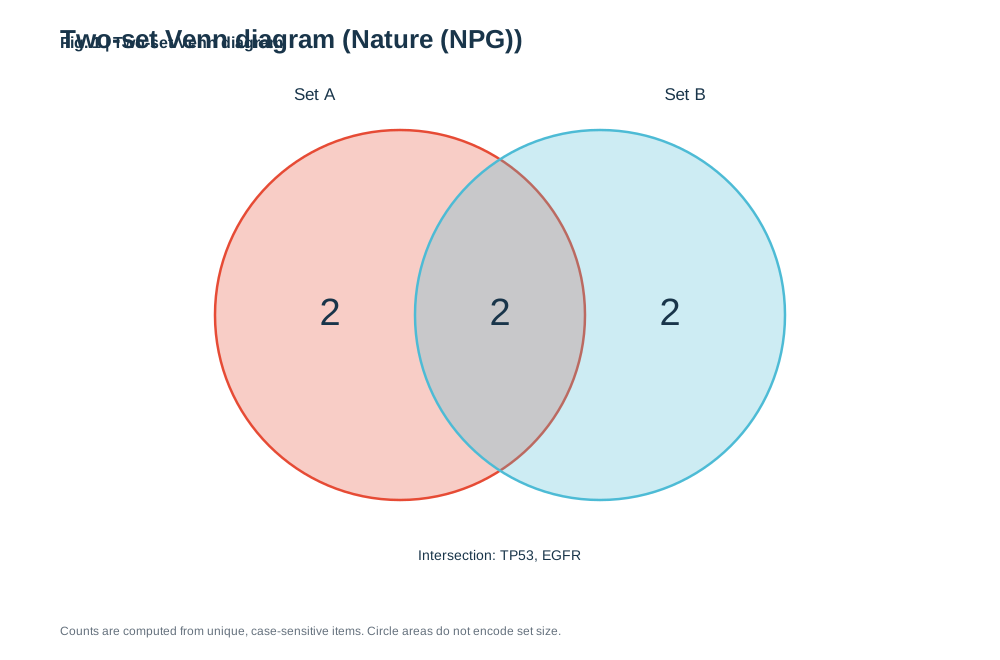
Use a Venn diagram when the question is about membership overlap and the number of sets is small.
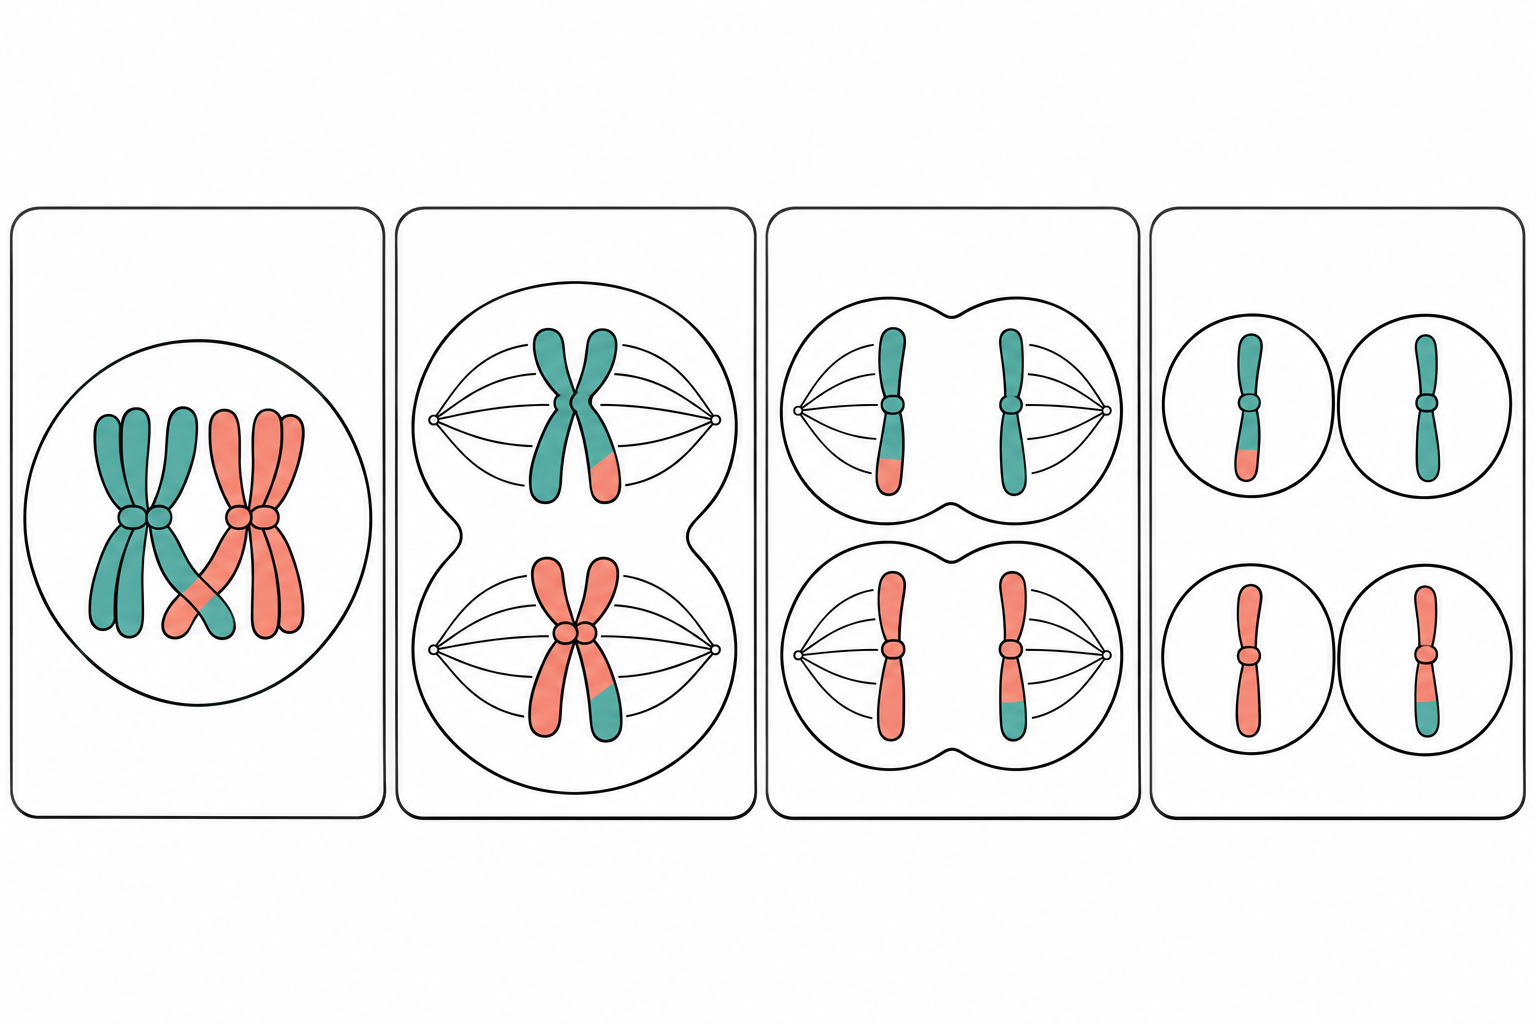
The sequence consists of DNA replication followed by two cell divisions.
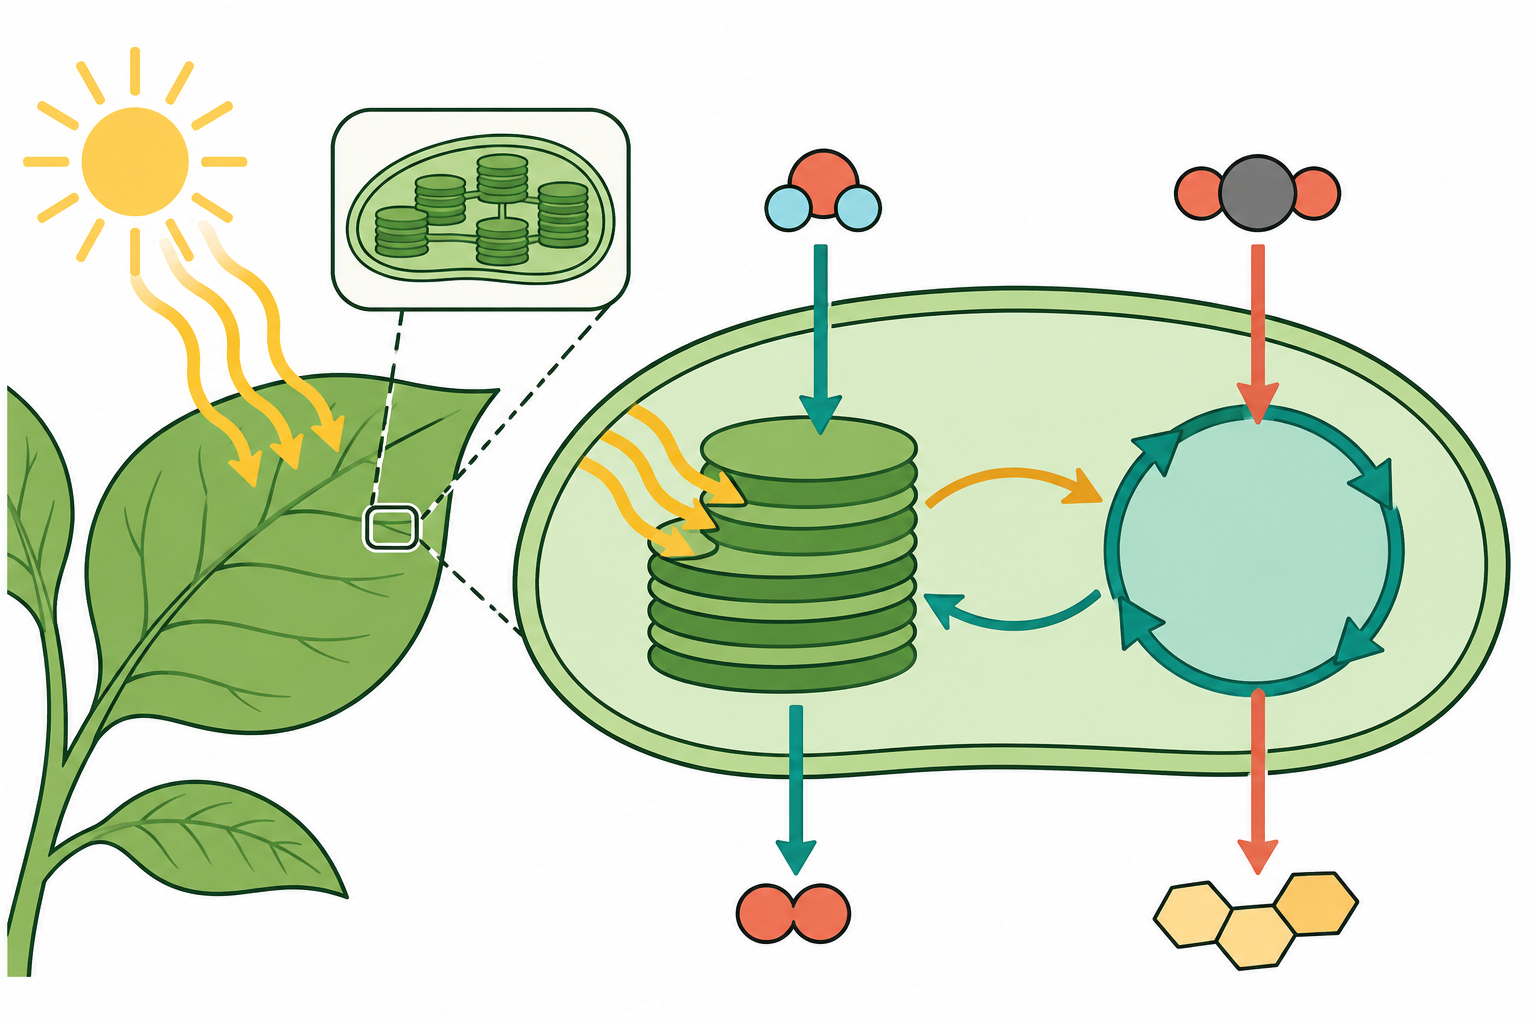
The light reactions provide chemical energy that is used in carbon fixation.
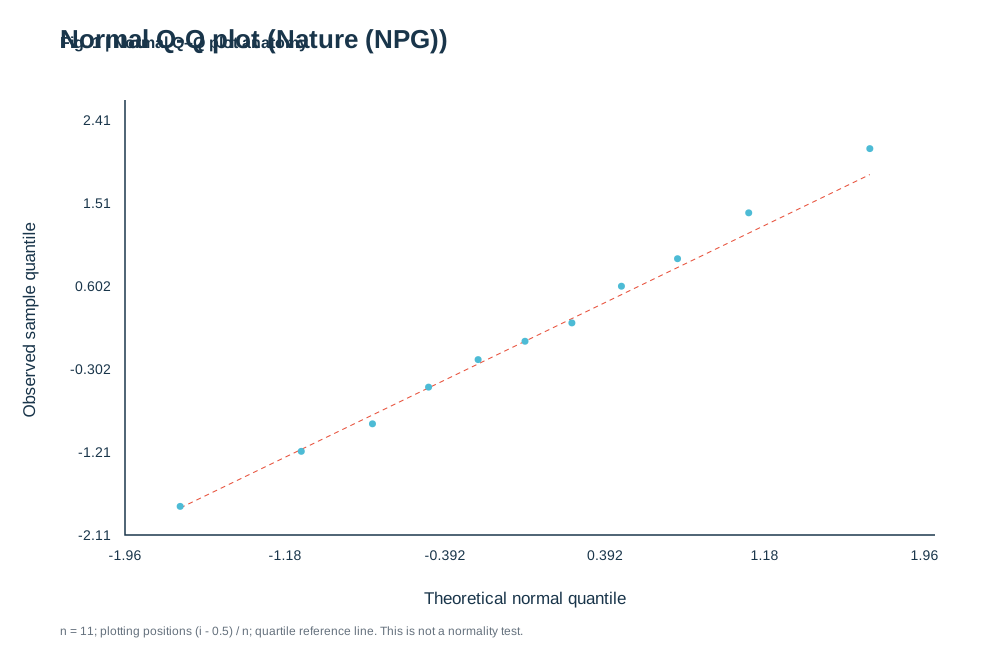
Look for the overall pattern first, then inspect bends and tail departures.
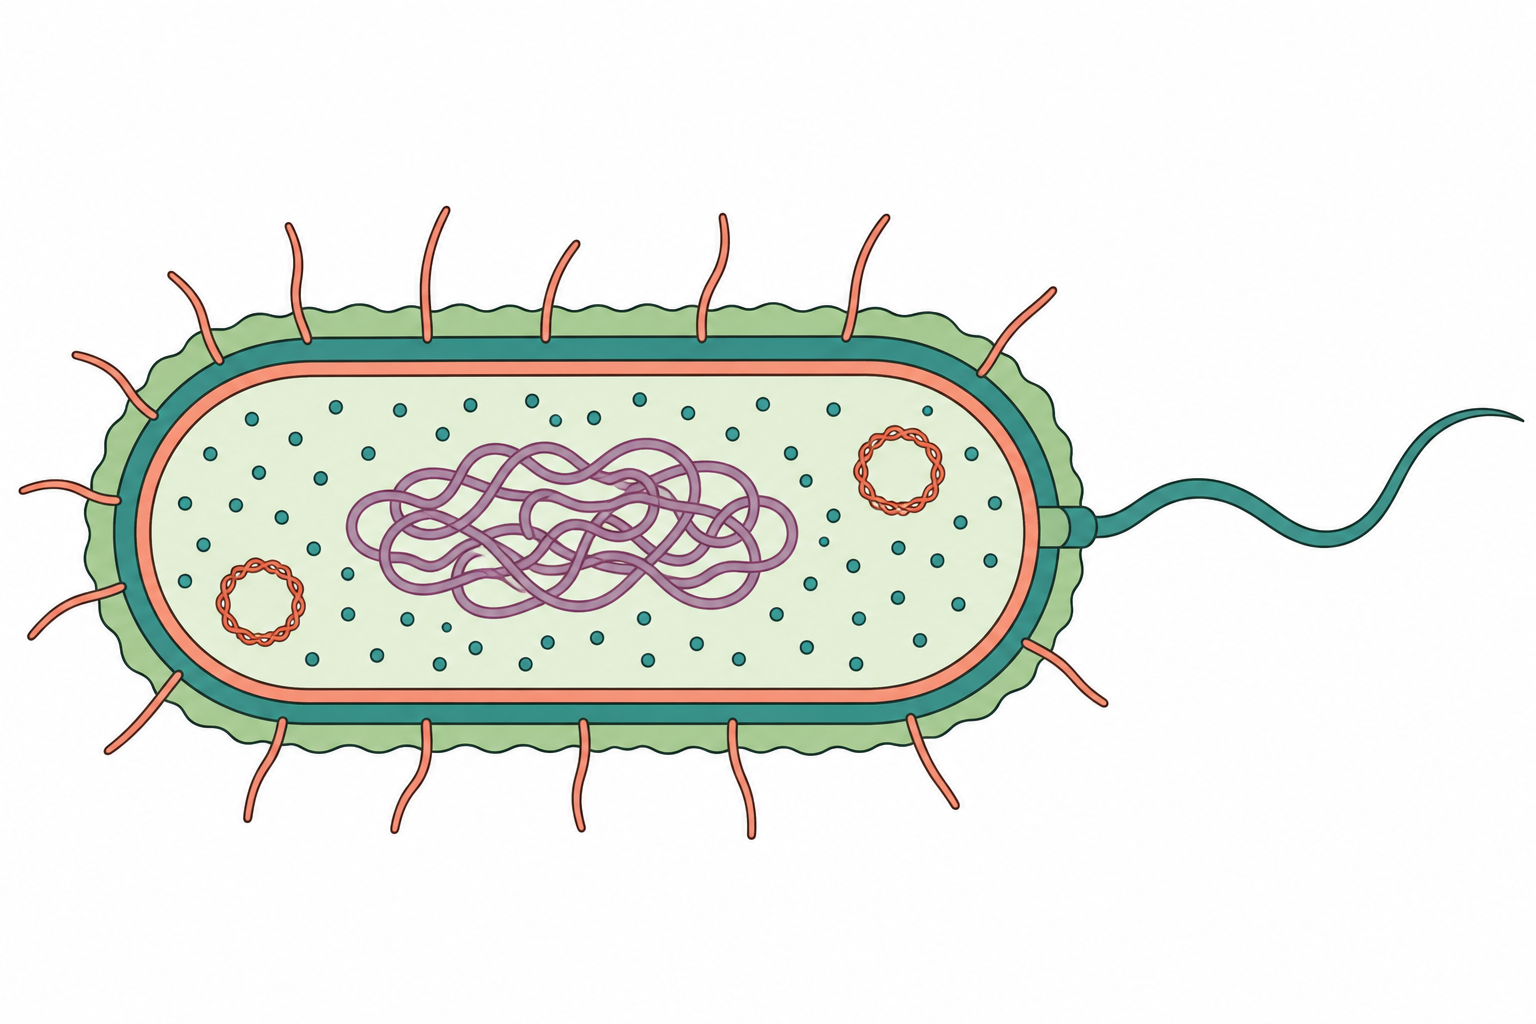
Choose labels that match the organism and the learning objective rather than showing every possible feature.
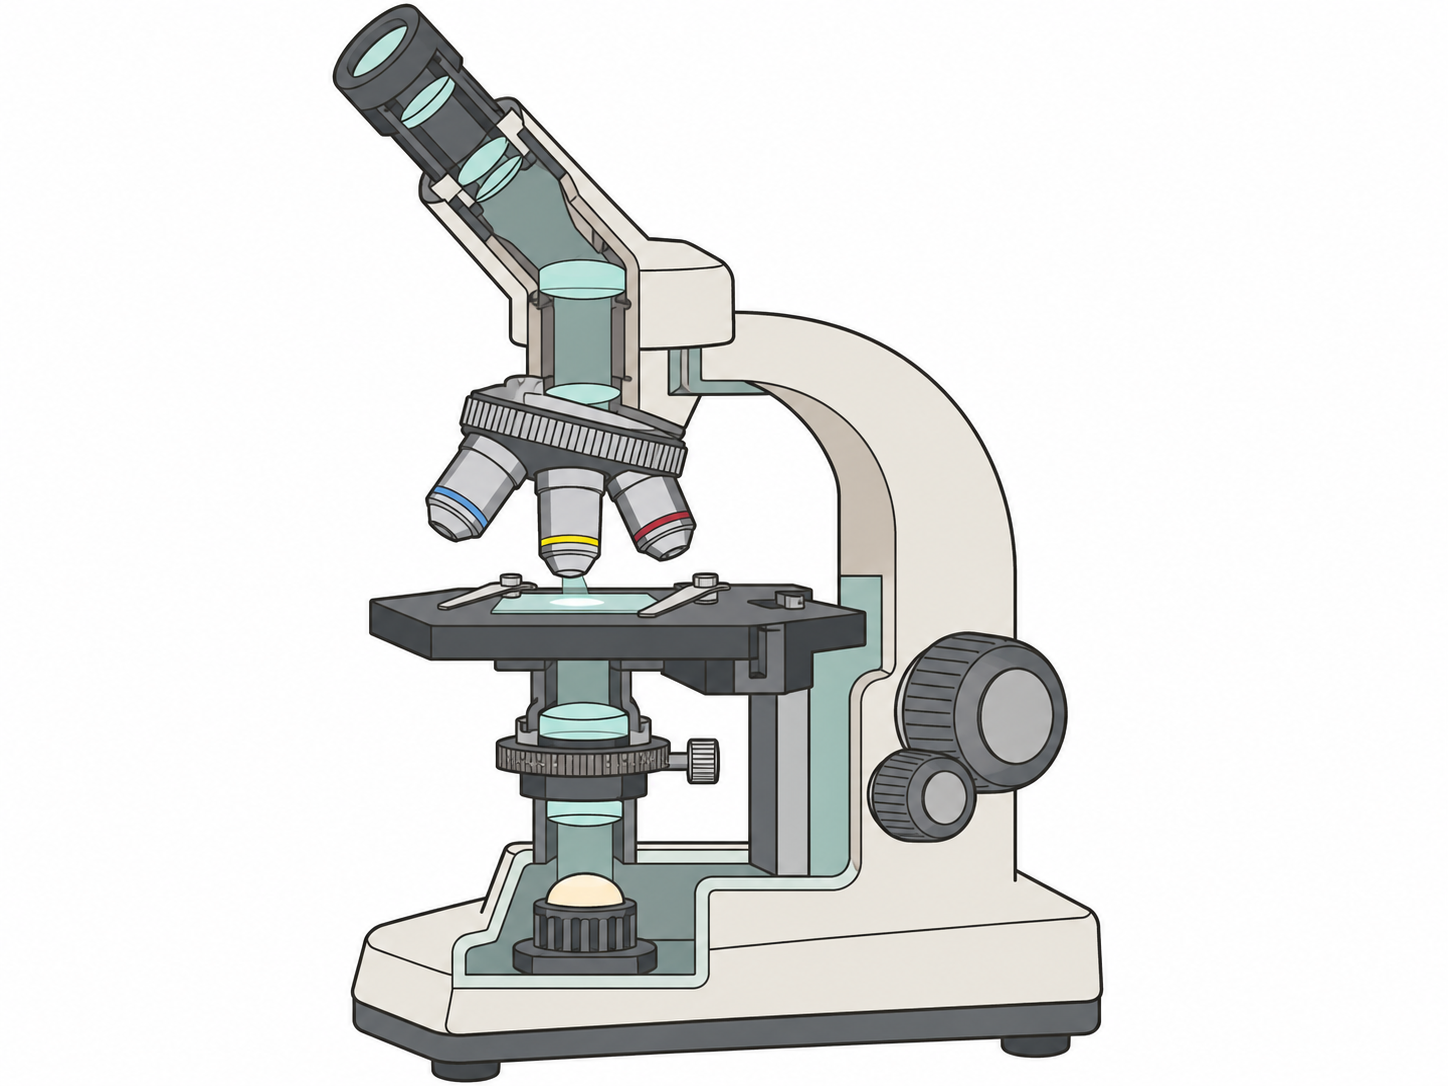
Follow the light path upward, then identify the parts that hold and position the specimen.
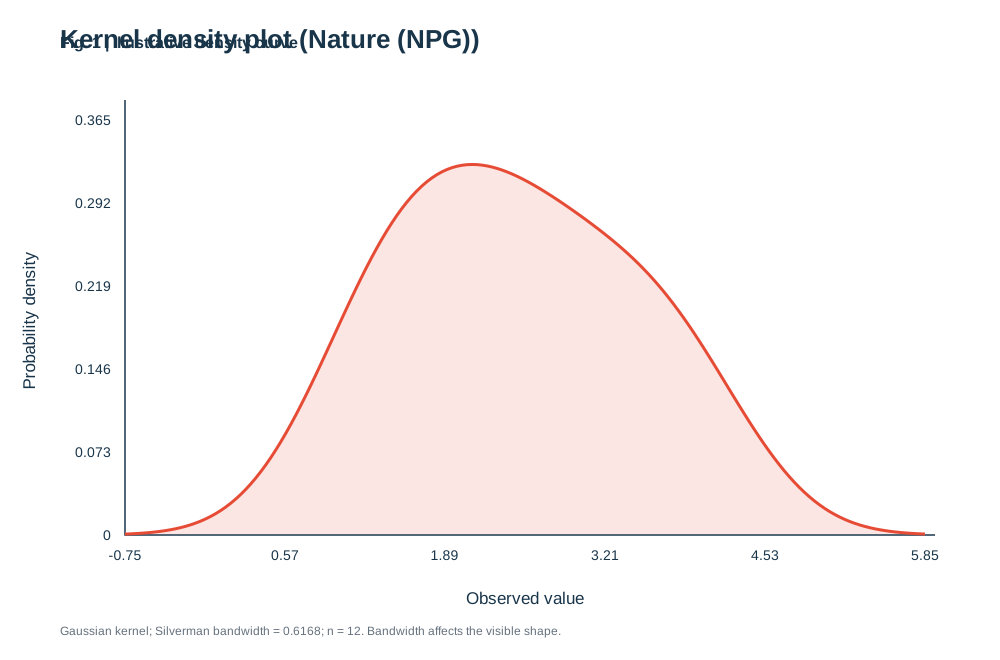
Interpret the curve as a smoothed view of distribution, with attention to scale and smoothing choices.
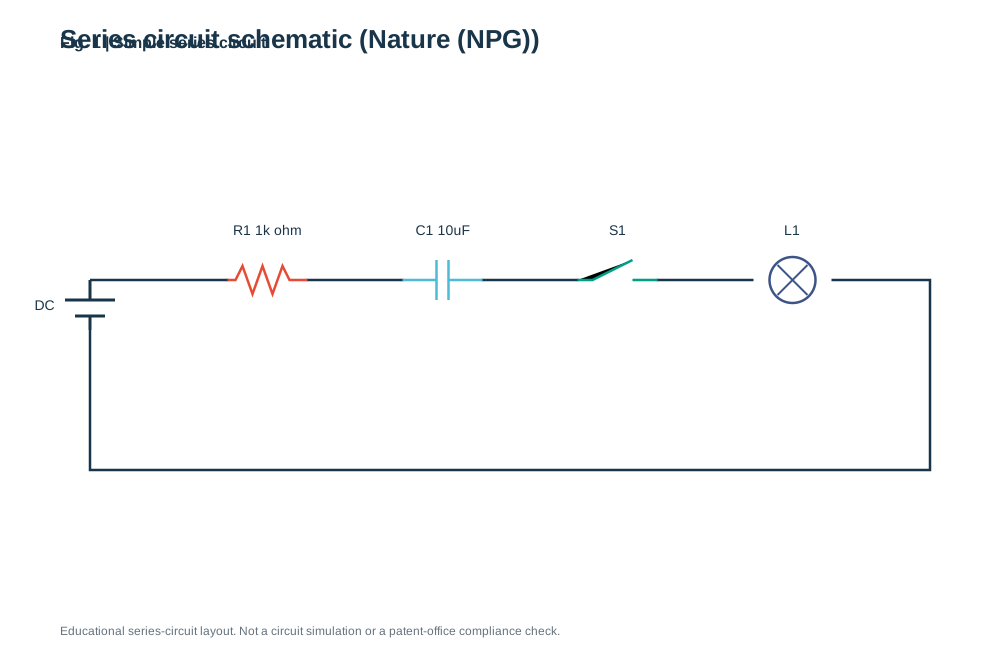
Trace the wires as continuous paths and identify each component by its symbol and reference label.
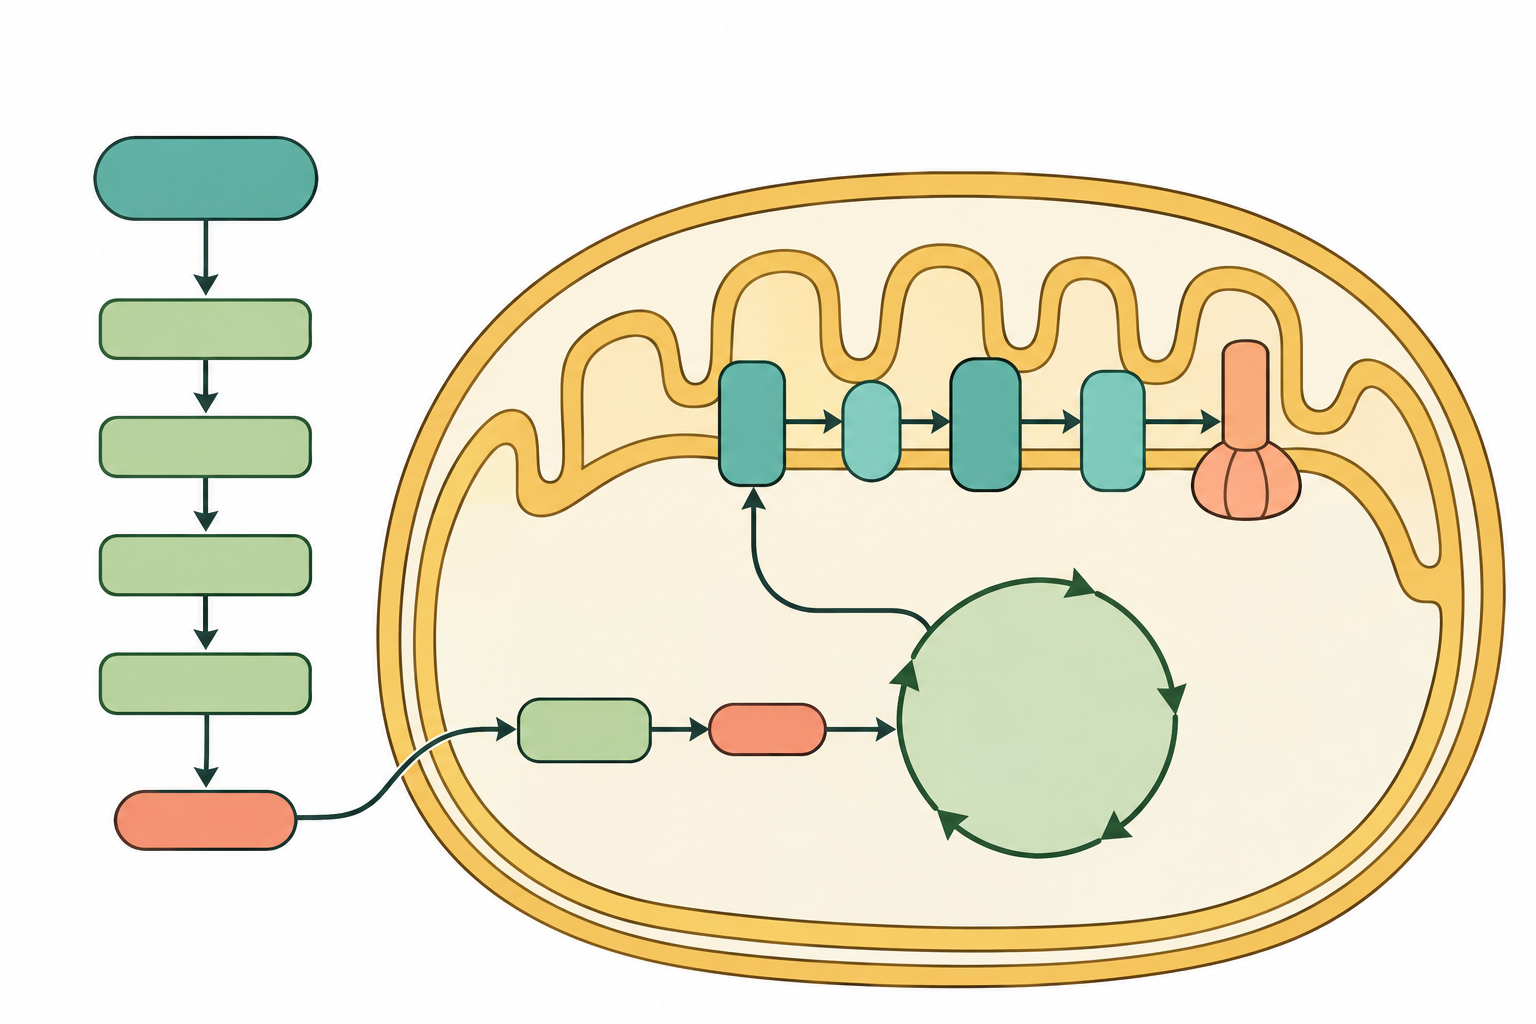
The pathway begins in the cytosol and continues through mitochondrial compartments in eukaryotic cells.
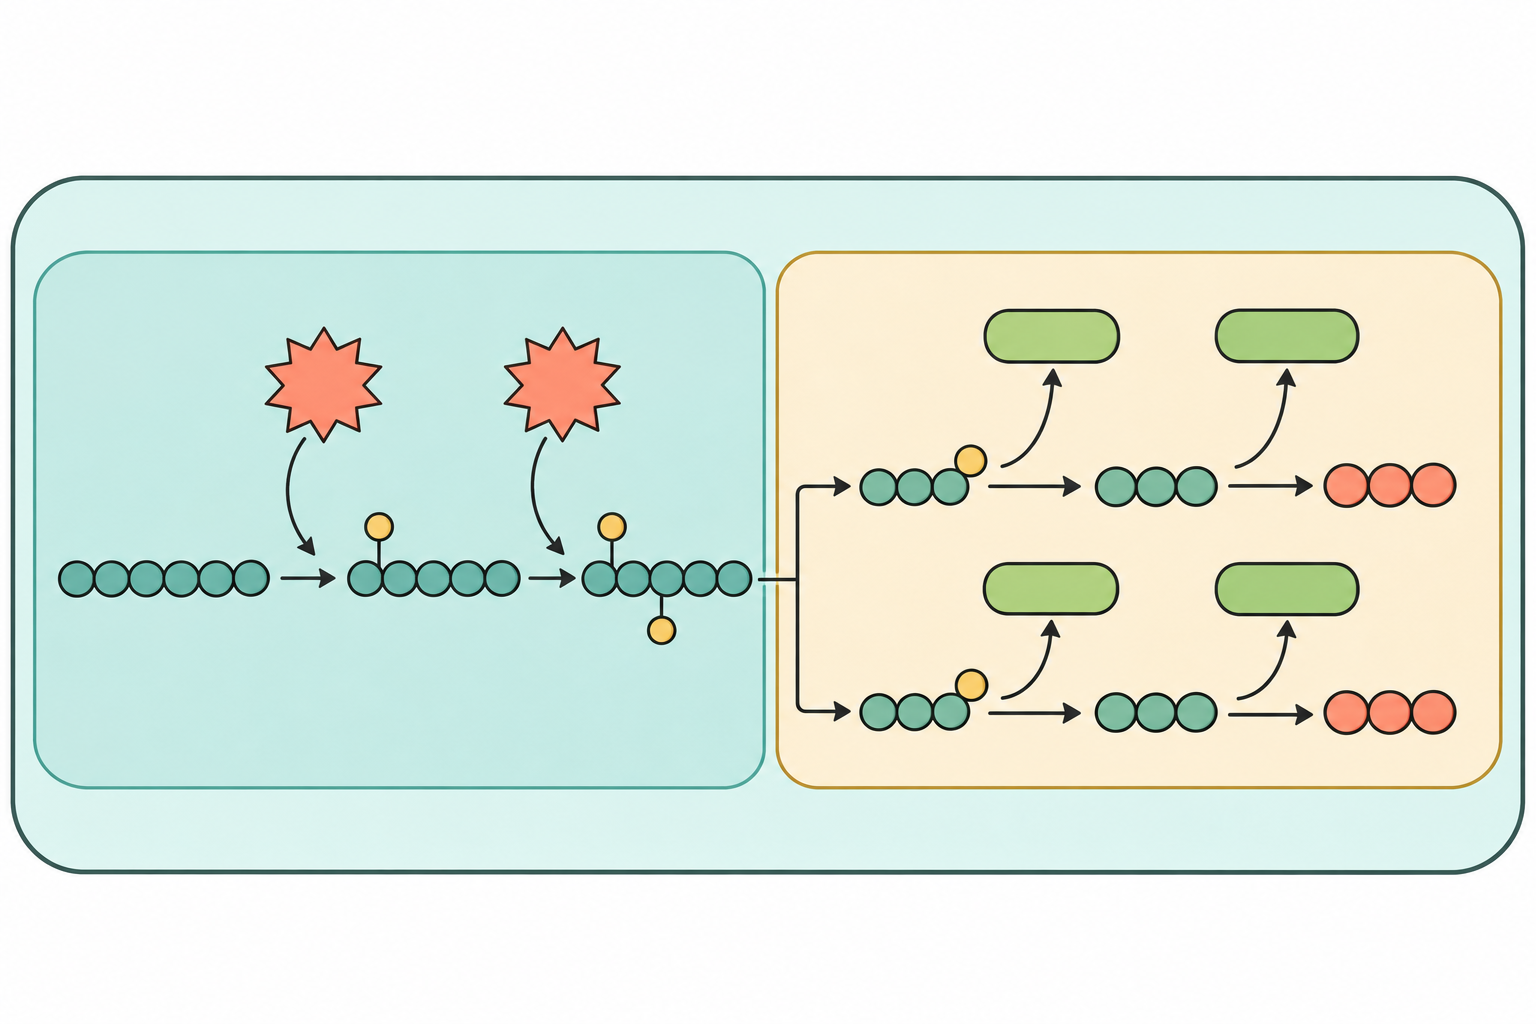
The pathway changes one six-carbon sugar into two three-carbon products.
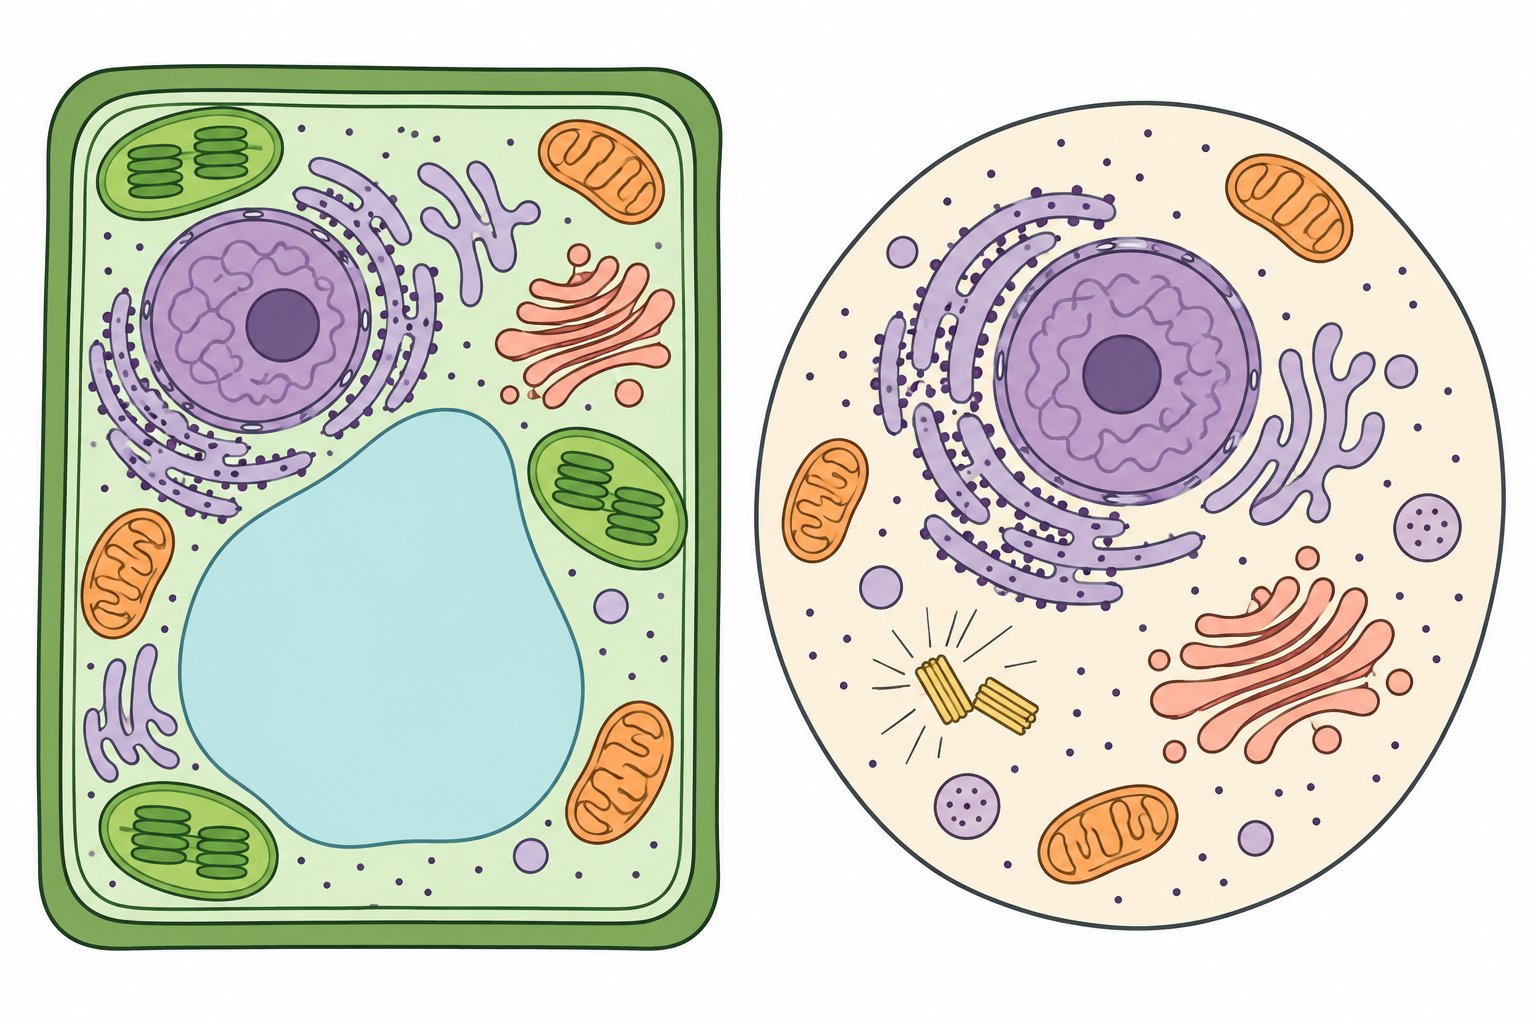
Both are eukaryotic cells, so they share core compartments even though their outer form and specialized structures differ.
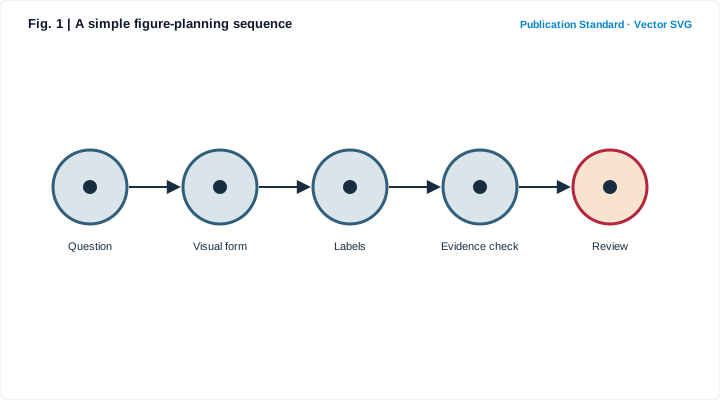
Treat the diagram as a visual argument: every shape, arrow, label, and color should help explain the intended relationship.
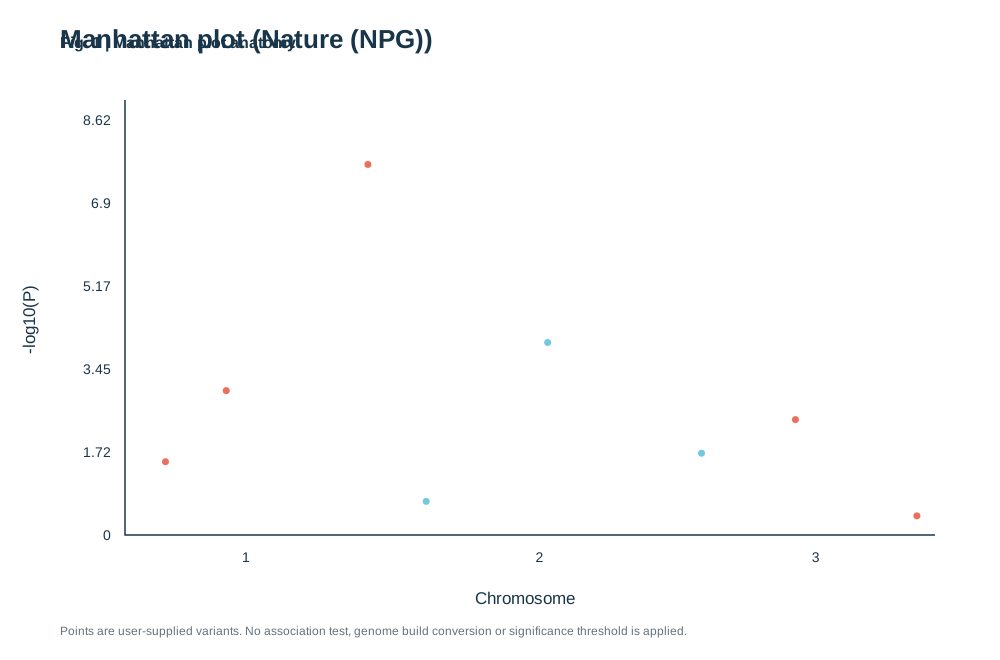
Look for peaks that cross a stated threshold, then inspect the locus and analysis details before drawing conclusions.
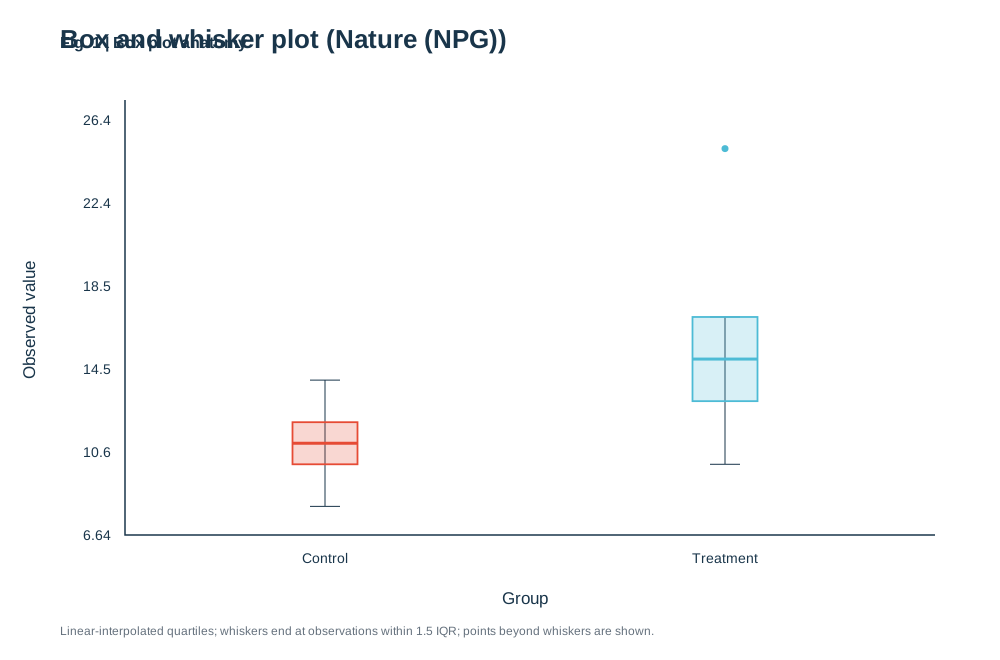
Read the box first, then check the whisker rule and how individual observations are displayed.
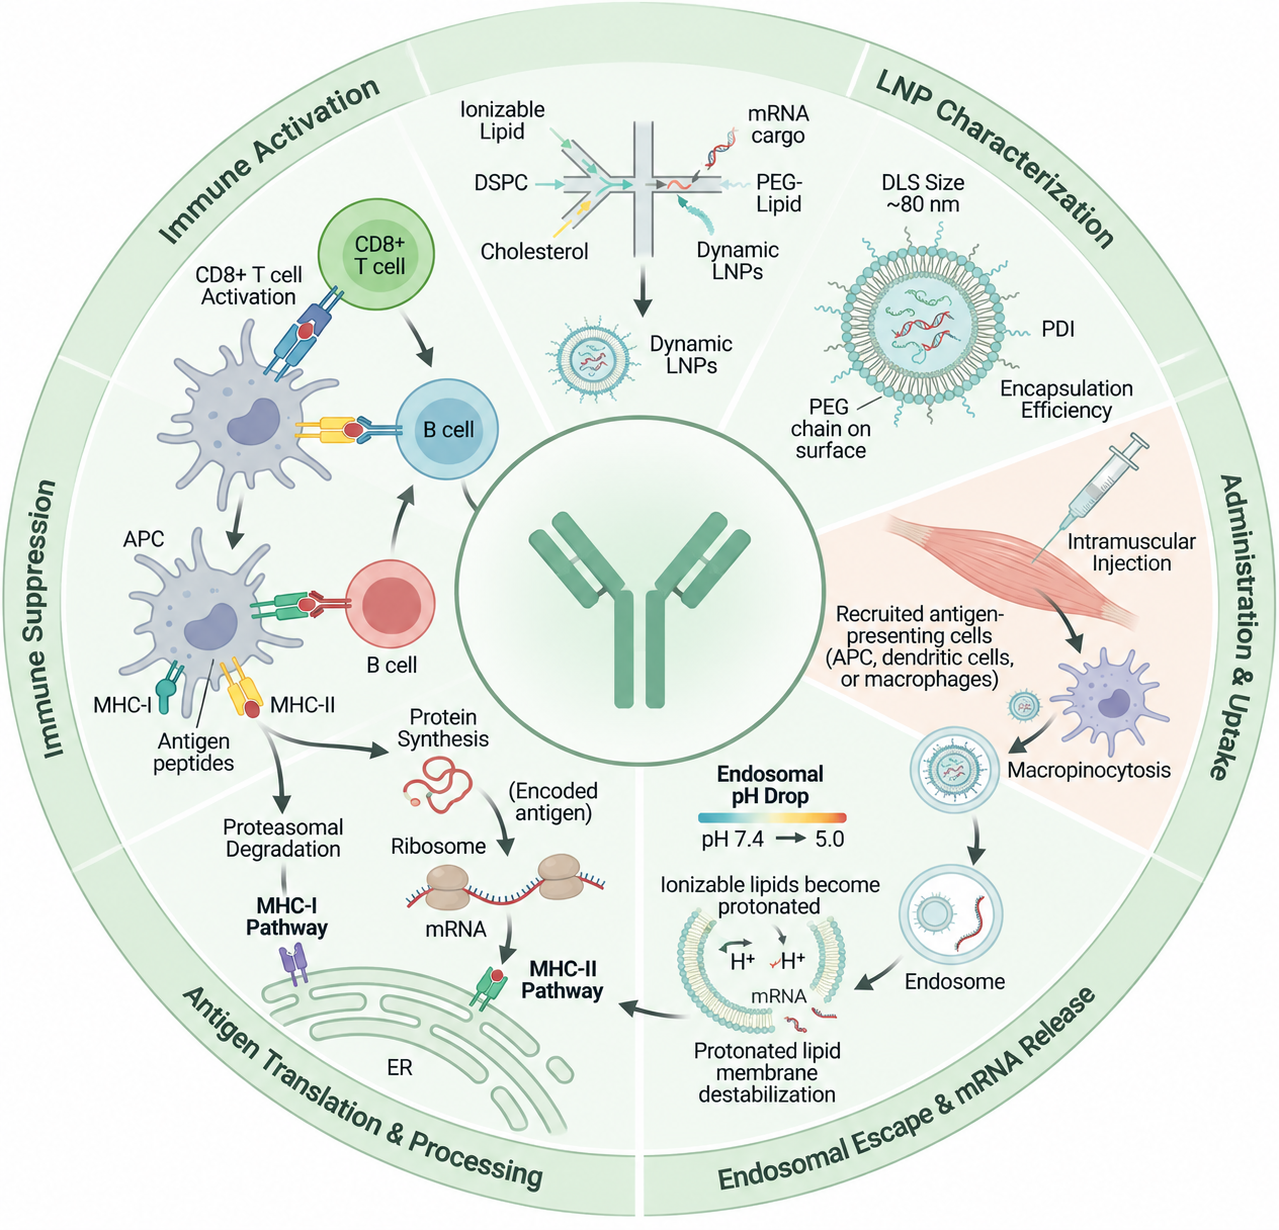
Project-supplied conceptual mechanism reference; verify the pathway against primary research before reuse.
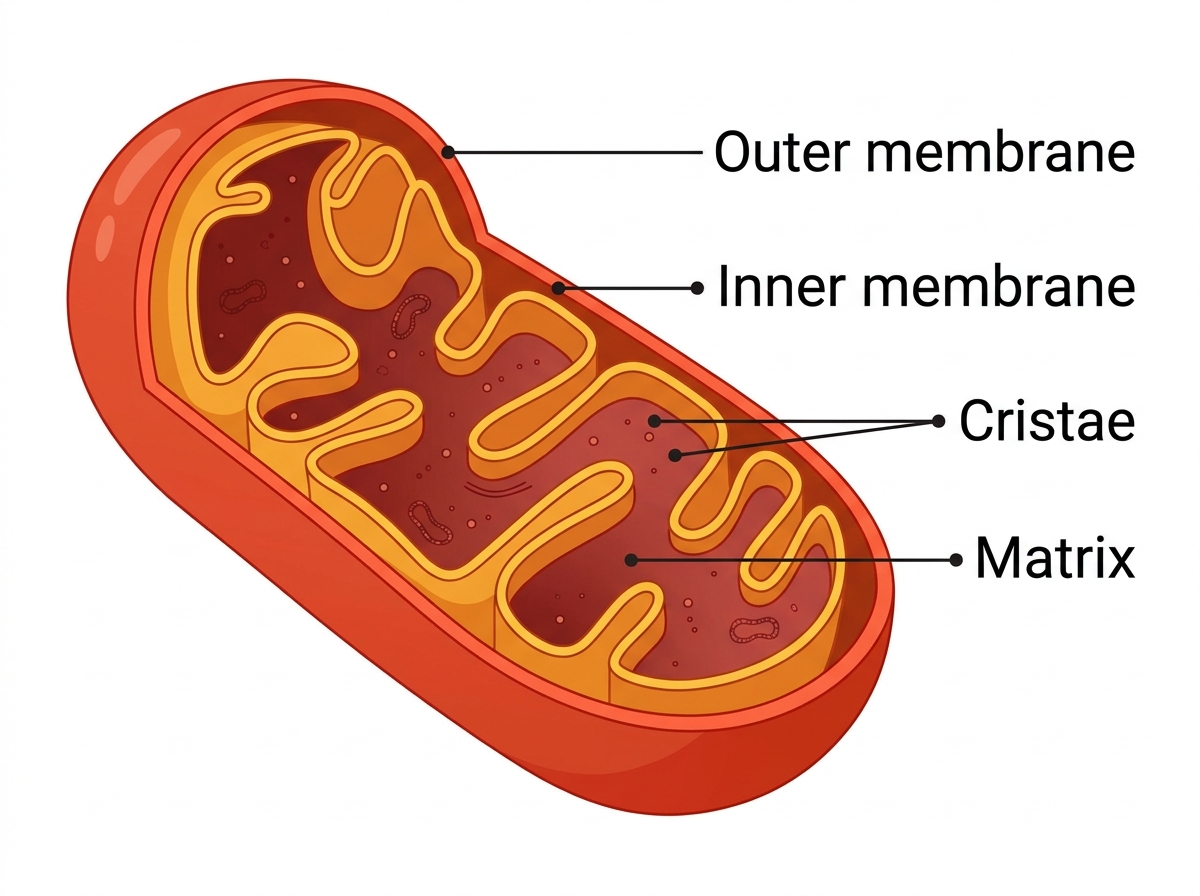
Project-supplied structural schematic; proportions and cristae are conceptual.
Reference schematics are provided for illustration. Statistical previews use synthetic demonstration data.