GraphAbs
Create: Box plot anatomy
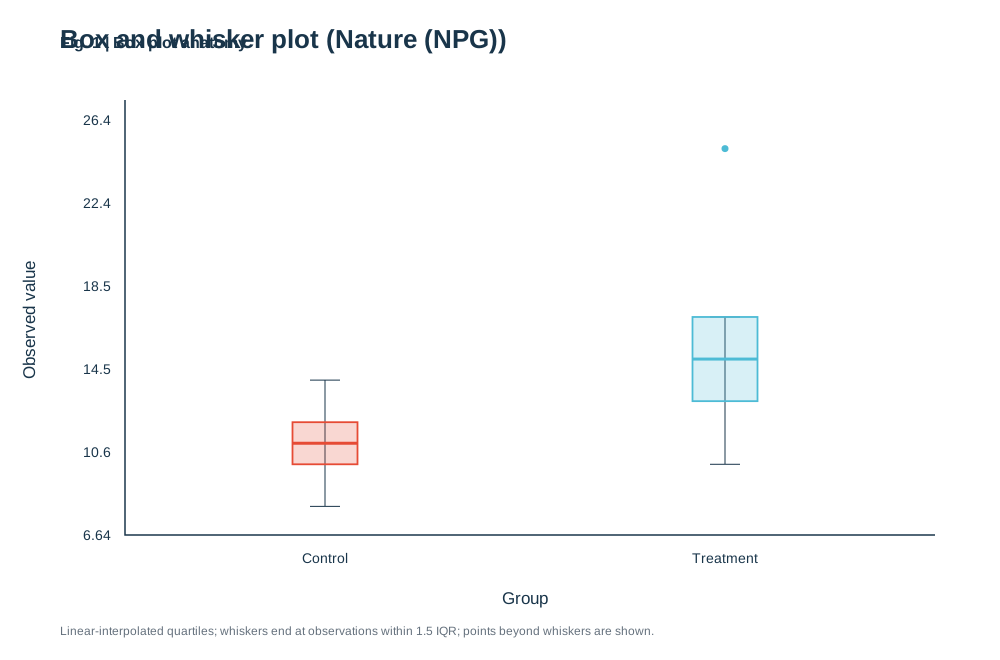
Use two columns: Group and Value, with at least three observations per group. Quartiles use linear interpolation. Whiskers reach observed values within 1.5 IQR; more distant points appear separately.
)%22%3E%3Crect%20width%3D%22100%25%22%20height%3D%22100%25%22%20fill%3D%22white%22%2F%3E%3Cstyle%3Etext%7Bfont-family%3AArial%2C%20Helvetica%2C%20sans-serif%3Bfill%3A%2319354a%7D.tick%7Bfont-size%3A14px%7D.label%7Bfont-size%3A17px%7D.small%7Bfont-size%3A12px%3Bfill%3A%2365717d%7D%3C%2Fstyle%3E%3Ctext%20x%3D%2260%22%20y%3D%2248%22%20font-size%3D%2226%22%20font-weight%3D%22700%22%3EBox%20and%20whisker%20plot%20(Nature%20(NPG))%3C%2Ftext%3E%3Cpath%20d%3D%22M125%20100V535H935%22%20fill%3D%22none%22%20stroke%3D%22%2319354a%22%20stroke-width%3D%221.5%22%2F%3E%3Ctext%20class%3D%22tick%22%20x%3D%22111%22%20y%3D%22540%22%20text-anchor%3D%22end%22%3E6.64%3C%2Ftext%3E%3Ctext%20class%3D%22tick%22%20x%3D%22111%22%20y%3D%22457%22%20text-anchor%3D%22end%22%3E10.6%3C%2Ftext%3E%3Ctext%20class%3D%22tick%22%20x%3D%22111%22%20y%3D%22374%22%20text-anchor%3D%22end%22%3E14.5%3C%2Ftext%3E%3Ctext%20class%3D%22tick%22%20x%3D%22111%22%20y%3D%22291.00000000000006%22%20text-anchor%3D%22end%22%3E18.5%3C%2Ftext%3E%3Ctext%20class%3D%22tick%22%20x%3D%22111%22%20y%3D%22208%22%20text-anchor%3D%22end%22%3E22.4%3C%2Ftext%3E%3Ctext%20class%3D%22tick%22%20x%3D%22111%22%20y%3D%22125%22%20text-anchor%3D%22end%22%3E26.4%3C%2Ftext%3E%3Ctext%20class%3D%22label%22%20x%3D%22525%22%20y%3D%22604%22%20text-anchor%3D%22middle%22%3EGroup%3C%2Ftext%3E%3Ctext%20class%3D%22label%22%20transform%3D%22translate(35%20320)%20rotate(-90)%22%20text-anchor%3D%22middle%22%3EObserved%20value%3C%2Ftext%3E%3Cpath%20d%3D%22M325%20506.37931034482756V380.1115618661257M310%20506.37931034482756H340M310%20380.1115618661257H340%22%20stroke%3D%22%2319354a%22%2F%3E%3Crect%20x%3D%22292.5%22%20y%3D%22422.2008113590264%22%20width%3D%2265%22%20height%3D%2242.08924949290059%22%20fill%3D%22%23E64B35%22%20fill-opacity%3D%220.22%22%20stroke%3D%22%23E64B35%22%20stroke-width%3D%221.8%22%2F%3E%3Cpath%20d%3D%22M292.5%20443.24543610547664H357.5%22%20stroke%3D%22%23E64B35%22%20stroke-width%3D%223%22%2F%3E%3Ctext%20class%3D%22tick%22%20x%3D%22325%22%20y%3D%22563%22%20text-anchor%3D%22middle%22%3EControl%3C%2Ftext%3E%3Cpath%20d%3D%22M725%20464.29006085192697V316.97768762677487M710%20464.29006085192697H740M710%20316.97768762677487H740%22%20stroke%3D%22%2319354a%22%2F%3E%3Crect%20x%3D%22692.5%22%20y%3D%22316.97768762677487%22%20width%3D%2265%22%20height%3D%2284.17849898580118%22%20fill%3D%22%234DBBD5%22%20fill-opacity%3D%220.22%22%20stroke%3D%22%234DBBD5%22%20stroke-width%3D%221.8%22%2F%3E%3Cpath%20d%3D%22M692.5%20359.06693711967546H757.5%22%20stroke%3D%22%234DBBD5%22%20stroke-width%3D%223%22%2F%3E%3Ctext%20class%3D%22tick%22%20x%3D%22725%22%20y%3D%22563%22%20text-anchor%3D%22middle%22%3ETreatment%3C%2Ftext%3E%3Ccircle%20cx%3D%22725%22%20cy%3D%22148.62068965517244%22%20r%3D%223.5%22%20fill%3D%22%234DBBD5%22%2F%3E%3Ctext%20x%3D%2260%22%20y%3D%22635%22%20class%3D%22small%22%3ELinear-interpolated%20quartiles%3B%20whiskers%20end%20at%20observations%20within%201.5%20IQR%3B%20points%20beyond%20whiskers%20are%20shown.%3C%2Ftext%3E%3C%2Fsvg%3E)
1. What is Box plot anatomy?
Scientific definition and academic background
A Box and Whisker Plot summarizes continuous variable distributions across cohorts using the five-number summary: minimum, first quartile (Q1), median, third quartile (Q3), and maximum. Modern journals heavily favor boxplots over misleading dynamite bar charts because they preserve distribution shape, spread, and outlier visibility.
Read the box first, then check the whisker rule and how individual observations are displayed.
2. Key Visual Anatomy & Elements
Deconstruction of axes, visual geometries, and annotations
Median Line
The solid bar inside the box denotes the median, robust against skewed outliers.
IQR Box
Spans from Q1 to Q3 (interquartile range), capturing the central half of the distribution.
Whiskers
Extends to the most extreme data point within 1.5 * IQR from the hinges (Tukey standard).
Outlier Markers
Observations exceeding 1.5 * IQR are plotted individually.
Jittered Raw Points
Individual biological replicates overlaid as jittered dots (Nature standard).
3. Required Data Schema & Formatting
Column definitions, value constraints, and data specifications
| Column | Type | Example | Role & Meaning | Required |
|---|---|---|---|---|
| Group | String | Control | Experimental cohort or treatment label | Required |
| Value | Float | 14.8 | Observed continuous quantitative measurement | Required |
Data Note: Each cohort requires at least 3 distinct observations. Quartiles and whiskers are calculated automatically.
4. Real Publication Sample Dataset
Copy sample data or load directly into the workspace above
Group,Value
Control,8.4
Control,10.2
Control,11.5
Control,12.1
Control,14.6
Control,9.8
Low Dose,12.3
Low Dose,14.5
Low Dose,15.8
Low Dose,16.2
Low Dose,18.0
High Dose,19.2
High Dose,22.4
High Dose,24.8
High Dose,26.1
High Dose,28.5
5. Scientific Insights & Publication Legend
Hypothesis addressed and a ready-to-use Nature/Cell figure legend template
Core Scientific Question:
Does the target biomarker demonstrate a dose-dependent shift across experimental interventions, and is the variance homogeneous?
Interpretation Guide:
Systematic upward displacement of the interquartile box confirms elevated expression; outliers outside whiskers should be verified.
Standard Journal Figure Legend Template:
6. Peer Review Solutions & Pitfall Prevention
Overcoming reviewer critiques and eliminating common desk-rejection traps
Reviewer demands: "Bar plots of continuous data are unacceptable; switch to box plots with all individual data points overlaid!"
Complies with Nature portfolio policy by plotting transparent points over true median/IQR boxes.
Reviewer asks: "Did you verify normal distribution assumptions?"
Box plots are non-parametric by design, presenting robust medians that survive skewness.
7. Reviewer Checklist & Journal Formatting Specs
Four indispensable pre-submission quality checks to ensure seamless editorial pass
Column Width
Nature 89 mm single column (2-4 cohorts) or 120 mm (5-8 cohorts)
Typography
Cohort names: 8 pt Arial; significance asterisks: bold 9 pt
Palettes
Sky blue (#0284c7), Light sky (#38bdf8), and Emerald (#10b981)
Resolution
Vector SVG or 600 DPI
Statistics note
State the whisker convention, sample size, and whether points are observations or outliers under a stated rule. This static example contains no measured data.